It’s no news that decision-making in academia is slow. Journals, conferences, edited collections, new haircuts – all of these things seem to take a while to happen in academic settings. So far, I’ve had the most experiences with waiting for conference acceptances (oh, and haircuts); I was shocked the first time I had to submit a proposal for a conference application nearly a year before the conference would actually happen.
The problem (problem?) is that I’m a bit of an opportunist when it comes to applying for things. So, I applied for a major conference in the rhetoric/composition community last year (read: CCCC) and got accepted! Hooray happy day!
But when that acceptance came in, it felt like – you know – it wouldn’t happen for a very long time. So, of course, that feeling that this very important thing is actually very far away was simply the beginning of a typical procrastination narrative: “Surely, I’ll have a much better idea of what exactly to do for this presentation if I wait, right?”
Now, to be fair, I had done a little bit of work on this project for the UC Writing Conference, and Katie Arosteguy, a member from the panel I was on, put together a pretty sweet-looking Wix site for us to put up our contributions (i.e. I posted a PowerPoint with my presentation on it).
So, I had something to get me started, but the PowerPoint struck me as a bit anemic, even as I was presenting it.
A little bit of context: the presentation is trying to answer the question of whether students see the value in acquiring digital literacy skills, and whether these skills seem useful for them (from their perspective). I’m defining digital literacy skills as the ability to create a website (e.g. a WordPress page or a blog, not anything requiring coding knowledge), to read texts closely in virtual spaces (e.g. online, in PDF readers), and to navigate web-based research through library databases. I realize others have more nuanced definitions of what digital literacy means, but I developed mine based on the NCTE’s definition. Their definition is (rightfully, purposefully) broad, and I know that the skills I associate with “digital literacy” now will likely change over time.
OK, that said: after doing some interviews, organizing a focus group, and close reading some digital literacy narrative I ask them to write (more on that in a moment…), I’m finding that a lot of students are not really seeing the same importance of learning digital literacy as – well – many of their instructors are. In fact, the digital literacy narratives (yes, more on this in a moment, really) seem to reveal that a lot of students have (or are at least performing for the sake of assignment) a certain kind of shame about their use of digital devices to read, write, and communicate, calling their use of computers “addictive” and “unproductive.” Sure, activity like going on Facebook 24/7 is probably not the most productive use of time, but the kind of work they do on Facebook is often rhetorical and (seriously), many of them will probably need to navigate more social networks in the future to find jobs and network with people. 21st century stuff.
Now, I don’t want to assert that it’s a problem that students think/feel this way; I want to make some bigger claims about why they might be feeling this way. I’m not going to talk about those “why” claims here (perhaps they’ll appear in a post to come and/or I’ll post my presentation materials from CCCC here), but what I do want to write about here (and what has taken me a really long time to get to; sorry!) is how I want to represent these ideas.
Students from five different sections of freshman writing have to write a digital literacy narrative, and I wanted to see if the repeated tropes in the narratives I read in my section were similar to the ones in other sections. I really wanted to see whether there were any trends in the things those students were writing about.
So, I did something I had never done before: I entered the big bad world of data. I took an afternoon to mine a bunch of past UWP portfolios and put together a huge corpus of digital literacy narratives. How did I do that?
Why, through Voyant Tools!
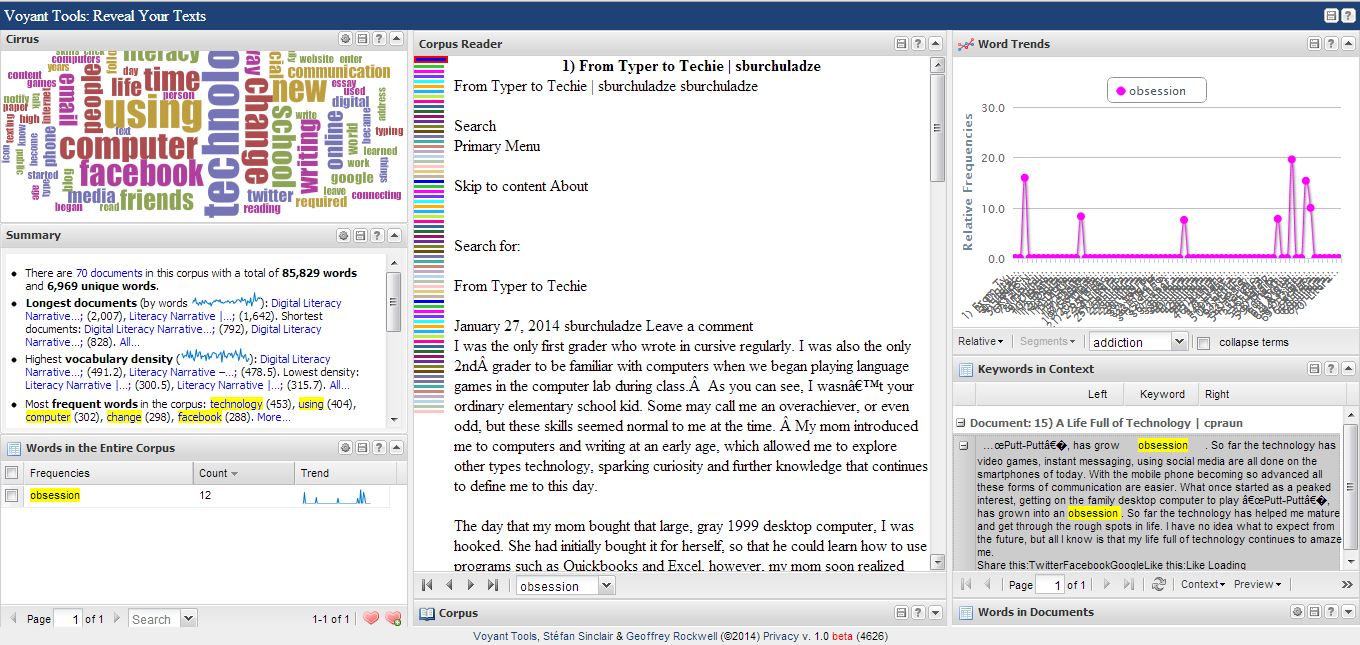
Now, this tool is awesome. After entering in the URLs of a bunch of student portfolios, I was able to create an insta-corpus where I could look at lists of the most-often-repeating words and create visualizations of the data, like Word Clouds and Collocations. Once you enter in all of your data, your page looks something like this:

I was looking at the patterns of a frequently used word, “obsession,” at the moment when I took this screen shot.
The most important thing I learned how to do while creating a textual visualization of my data was to use a “stop list.” This is a list of words that the corpus will ignore in its analysis, so that the analysis is not just spitting out data like, “Hey, look, the most frequently-used word in these narratives is ‘I’!” Isn’t that neat??”
Voyant Tools has its own stop list (in English and other languages), but I found myself adapting the stop list a lot, making sure that words appearing in WordPress templates (like the word, “WordPress”) were not analyzed. It was fun going through and pruning, making sure I could make as much sense of a large body of texts as possible (hey, is this what they all mean when they’re talking about Digital Humanities work? Side note for another time as well).
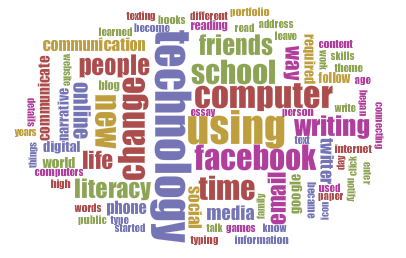
I’m really new to any kind of textual and linguistic analysis, so I’m sure there’s still a lot for me to learn, but I was surprised at how easy it was to find this tool and how simple it was to use. Check out how cool this word cloud is!
The collocation is actually even more interesting than this, but again, I think the analysis (and my impressions of how different doing analysis based on large bodies of text and visualizations) will have to wait for a Part 2 to this post…


